Sample dataset and preprocessing
We are analyzing Fumarate and nitrate reduction (FNR) transcription factor dataset in this tutorial (Myers et al., 2013). FNR transcription factor controls the expression of over 100 target genes in response to anoxia. It facilitates the adaptation to anaerobic growth conditions by regulating the expression of gene products that are involved in anaerobic energy metabolism. We will use the FNR IP ChIP-seq Anaerobic A (GSM1010219) dataset and compare this with the control sample (GSM1010224).
Input Data:
| Input | Description | Location |
|---|---|---|
| FNR transcription factor data | FNR IP and Input DNA in anaerobic condition | iplantcollaborative > example_data > chipseq_webinar -> fastqfiles |
Preprocessing
Evaluate the quality of your sequencing data using FastQC
Preprocessing of ChIP-seq data is similar to that of any other sequencing data and will assess the quality of the raw reads to identify possible sequencing errors or biases. FastQC can be used for an overview of the data quality but this does not assess if your ChIP experiment has worked. We will assess that in Step4- Postprocessing- ChIP quality assessment.
- Login to the Discovery Environment.
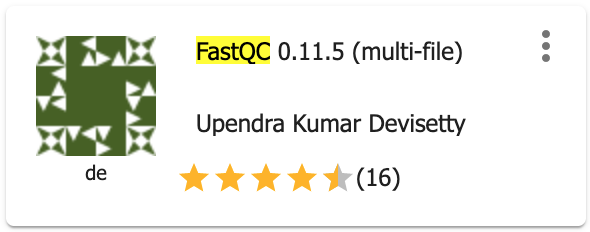
- CLick on “Apps” tab in the Discovery Environment and search for “fastqc”.
- Click on the app icon.
- Change the name of the analysis and output folder as needed or leave for defaults.
- Under “Input” click on Add to provide input files for both ChIP and input dataset. Sample dataset location iplantcollaborative > example_data > chipseq_webinar -> fastqfiles. Check both files (SRR576933_IP.fastq, SRR576938_input.fastq) and click ‘OK’.
- For next section “Resource Requirements” request resources as needed or leave for defaults
- Click Launch Analysis. You will receive a notification that the job has been submitted and running. Click on the Analyses tab to check the status of your job. When the analysis completes, click on the right three dots menu and click on ‘Go to output folder’ to access you output files.
Output/Results
| Output | Description | Example |
|---|---|---|
| html and zip files | FastqQC report | SRR576933_IP_fastqc.html |
Description of output and results
Click on the html report files and check if your sequencing data has any red flags that you should be aware of. There are few red flags in the report. You will notice that “Per base sequence quality” decrease towards the end of the reads which is usual with illumina sequencing. Other useful metrices that should be checked for ChIP-seq data are: sequence duplication levels and over-represented sequences. Check the tutorial on how to evaluate high-throughput sequencing reads with FastQC.
As this report does not present any major concerns regarding the quality of this dataset, we will proceed for the next step ,i.e., reads alignment. However, for your own data, it is a good pratice to rerun fastqc after quality filtering your reads: remove adapter sequences and low-quality bases (Phred quality score< 20) and discard any short reads after trimming (<20bp reads). Check Trimmomatic app in CyVerse DE which can be used to trim and crop Illumina (FASTQ) data as well as to remove adapters. Access CyVerse trimmomatic app tutorial here.
For more details on each module of the fastqc report, check FastQC documentation
Fix or improve this documentation
- Search for an answer: CyVerse Learning Center
- Ask us for help:
click
 on the lower right-hand side of the page
 - Report an issue or submit a change: Github Repo Link
- Send feedback: Tutorials@CyVerse.org

